Category Archives: Green Card & Citizenship

Information to become a permanent resident, get a passport, vote and becoming a US citizen

US v Australia Immigration: Green Cards & Permanent Residency

It is no surprise to regular readers that we have harped on in recent months in light of the US Immigration Reform bill now which has passed the Senate (albeit stalled in the House of Representatives) about the ills of the Immigration system, the state of Immigration today, general statistical trends as well as comparisons to other countries and how much this is hurting the US economy at large.

Well we recently came across a great infographic comparing US and Australian immigration and the access to Permanent Residency that crystalizes simply the problem that exists today. Both countries are modern western countries with high standards of living, high level GDP per capita and huge diversity in the populace due to the founding and growth of the respective countries fueled by global immigration.

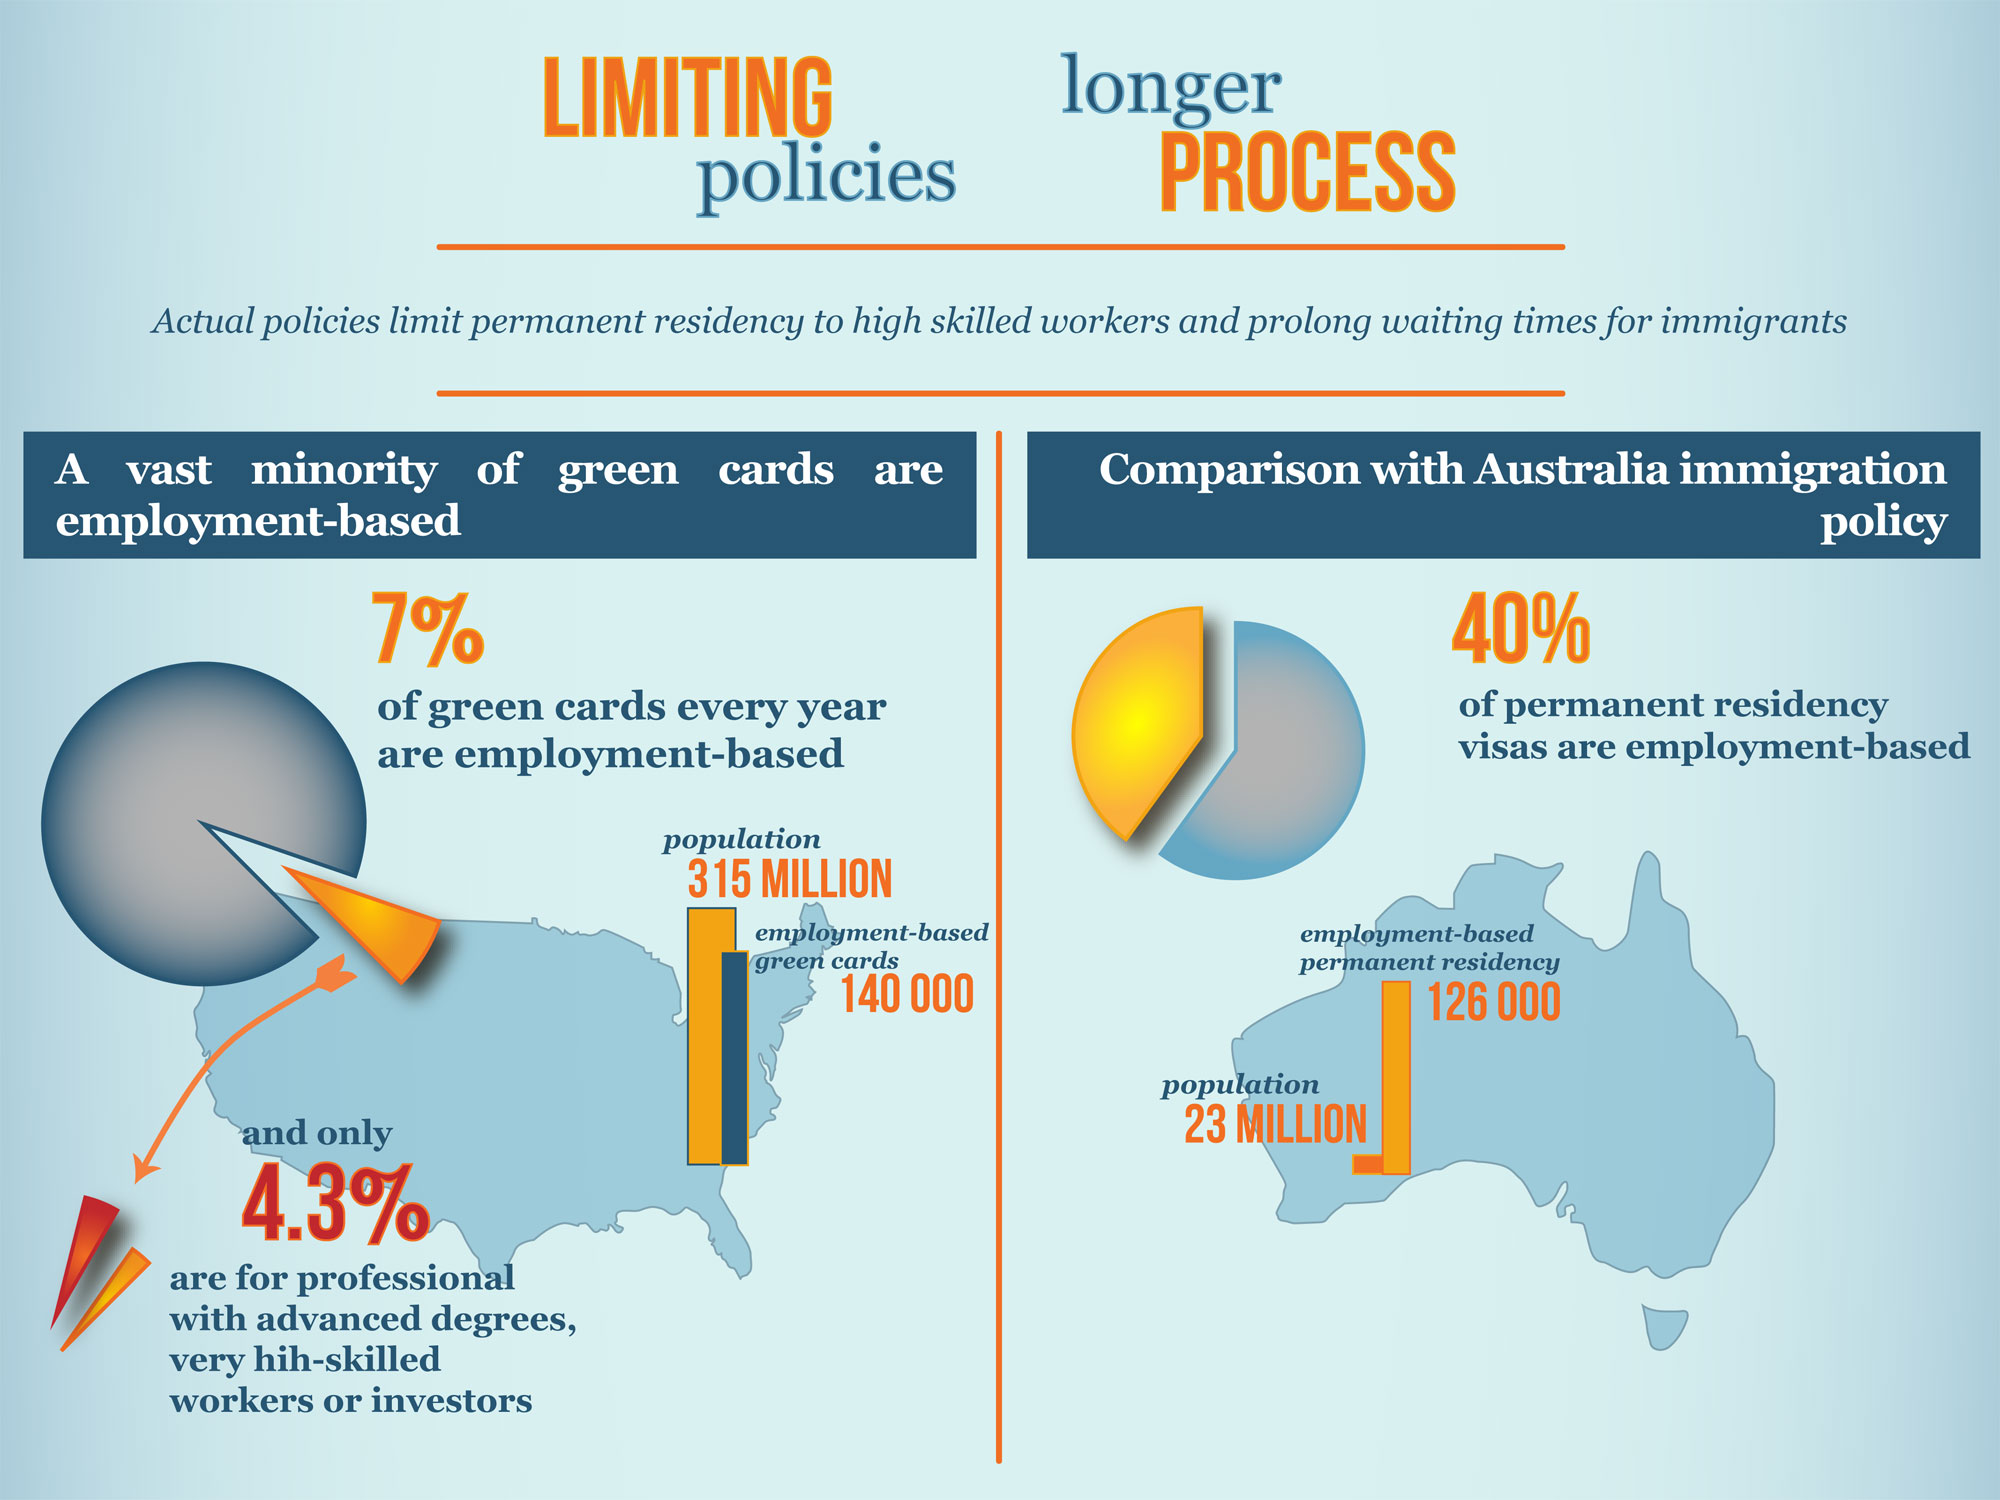
However there are a couple of major differences. While proportionally Australia has a higher foreign born and immigrant population it is only a nation of 23 million vs. 315 million in the US. Despite that the amount of Permanent Residency approvals (often called Green Cards in the US) for employment based or skilled based reasons is almost the same annually. Australia has about 129,000 vs. the US having 140,000.

US v Australia Immigration Permanent Residency


(courtesy Tatiana GalzyFi2W is featuring stories by students in the Feet in 2 Worlds journalism course at The New School)

The major reason for this disparity is the fact Australia issues 40% of all Permanent Residents for skilled employment reasons thus having a net positive to the economy. However the US only issues 7% of all Green Cards for the same group and only 4.3% are the cream of the crop high skilled or vastly experienced professionals.

Why is this a problem?

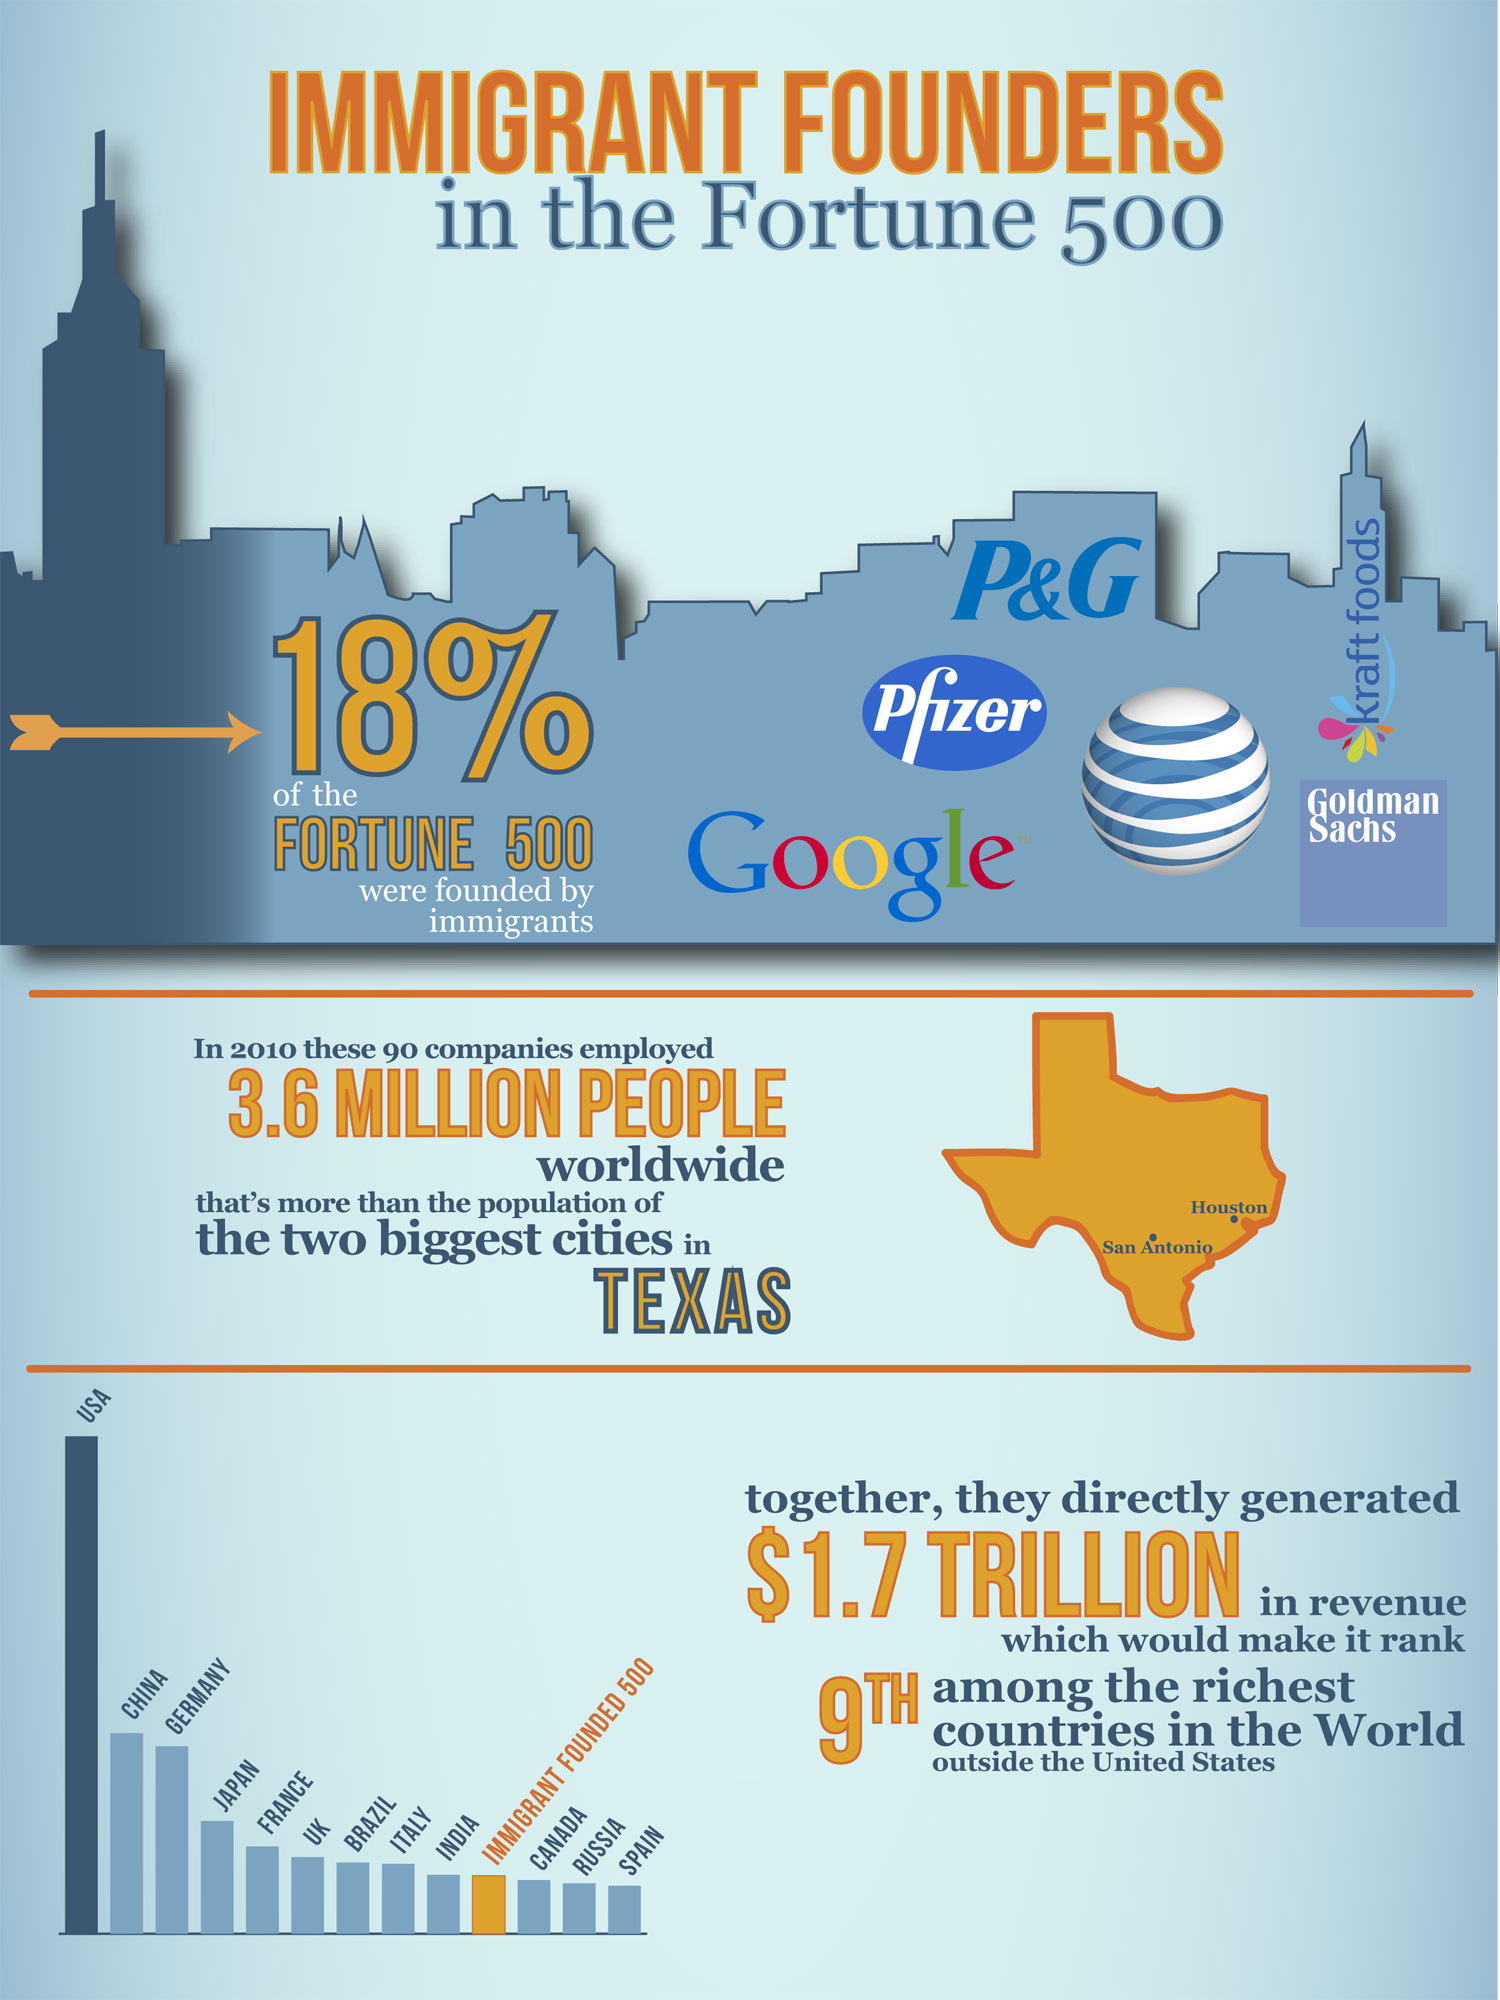
Well to keep with the simplicity of the article, we present a last image to leave you with. If the Top 500 Immigrant founded US companies (an Immigrant Fortune 500 if you will) were an economy unto themselves, they would be the 9th largest economy in the world. And that is only from direct economic benefit not counting indirect benefit such as the flow on effect to other industries and companies as well as what their combined 3.6 million employees further do with their salaries. To put that into perspective that is bigger than the economies of Russia or Canada as a whole at 1.7 Trillion USD.

Infographic-immigrants-in-500s-v3


(courtesy Tatiana Galzy)

So the next time someone has an argument with you about US Immigration policy and wanting it to be more conservative and your reasoned verbal and written arguments don’t work, it may be these 2 simple charts that paint the best and clearest picture.

Cj

Green Card Salary & Country Statistics

Recently we published some demographic and employer sponsor statistic data about Green Cards and H-1B Visas/E-3 Visas to give foreigners and folks insight into how the whole US Immigration process operates and hopefully helps them in their journey to live and work in the US.

Today we are going to look briefly at the average salary levels as well as raw number of Permanent Residency applications for the Top 50 countries in 2013. It should be noted that this data is for the employer sponsored Green Cards like EB-1, EB-2 and EB-3 and not the family sponsored and other green cards like the Green Card Lottery. This group on an annual basis in terms of Green Cards issued only makes up about 13% of the Green Cards given to foreigners. This is a major issue trying to be addressed in the current US Immigration Reform debate for the US to be more high skill focussed as other countries are with who they give Permanent Residence too.

It is clearly immediately evident as elsewhere with the data, that Indian national dominate the raw total with over 56% of the applications in this annual period. It is also a reason under the current system why the delay for these foreign nationals to get actual Green Cards made available to them can result in waits of 10 years or more.

It is also interesting to see (although small in number) that Lebanon, The Netherlands and Jordan are the Top 3 nations in terms of average salary of their foreign nationals sponsored roles suggested the high skill, experience and specialized desired knowledge of these candidates. Interestingly Asian powerhouses with highly educated societies, Japan and South Korea have amongst the lowest 10 average salaries for their foreign nationals. It is possible in a society like the US where individual and direct salary negotiation is at the heart of the compensation scheme that residents where strong direct negotiation with money and lesser English skills may be a partial cause of this disparity.

Country Continent Green Card Apps. Prop. Avg. Salary
Lebanon Asia 144 0.23% $135,395
Netherlands Europe 125 0.20% $123,660
Jordan Asia 115 0.19% $121,549
United Kingdom Europe 923 1.50% $120,755
Israel Europe 334 0.54% $120,147
Egypt Africa 179 0.29% $114,484
Australia Oceania 270 0.44% $113,117
Ireland Europe 138 0.22% $112,851
Canada North America 3,057 4.98% $112,597
France Europe 487 0.79% $111,325
Argentina South America 218 0.36% $108,866
Germany Europe 477 0.78% $108,544
Nigeria Africa 220 0.36% $107,095
Pakistan Asia 818 1.33% $106,955
Singapore Asia 172 0.28% $105,218
Ghana Africa 122 0.20% $102,668
Russia Europe 402 0.65% $99,526
South Africa Africa 147 0.24% $98,905
India Asia 34,490 56.19% $97,578
Romania Europe 229 0.37% $96,571
Italy Europe 298 0.49% $96,441
Bulgaria Europe 140 0.23% $91,728
Spain Europe 202 0.33% $91,478
Brazil South America 471 0.77% $91,392
Ukraine Europe 181 0.29% $90,795
Nepal Asia 519 0.85% $90,414
Venezuela South America 499 0.81% $90,254
Bangladesh Asia 177 0.29% $89,731
China Asia 3,782 6.16% $89,061
Malaysia Asia 247 0.40% $88,781
Iran Asia 256 0.42% $87,642
Thailand Asia 161 0.26% $87,119
Hong Kong Asia 113 0.18% $86,085
Vietnam Asia 117 0.19% $85,534
Kenya Africa 121 0.20% $85,375
Colombia South America 381 0.62% $84,788
Turkey Europe 558 0.91% $84,710
Peru South America 187 0.30% $83,980
Sri Lanka Asia 137 0.22% $83,333
Indonesia Asia 219 0.36% $79,640
Japan Asia 659 1.07% $79,336
Taiwan Asia 866 1.41% $76,015
Poland Europe 262 0.43% $72,001
Jamaica North America 149 0.24% $71,652
South Korea Asia 3,390 5.52% $69,680
Philippines Asia 2,016 3.28% $67,960
Mexico North America 1,733 2.82% $66,561
Mongolia Asia 102 0.17% $56,440
Ecuador South America 270 0.44% $55,740
Guatemala North America 106 0.17% $45,403